Fang, Kuhn, et al. 2023 Appendix
Appendix for: D. Fang, S. V. Kuhn, W. Kaufmann, M. A. Kraus, and C. Mueller, “Quantifying the influence of continuous and discrete design decisions using sensitivities,” in Advances in Architectural Geometry 2023, Stuttgart, Germany, Oct. 2023. https://doi.org/10.1515/9783111162683-031. [project page]
Early-stage design decisions have a large impact on the performance of buildings. Especially the case of mixed (continuous and discrete) design variables can complicate human and computer understandings of how individual choices contribute to performance, in both in both direction and intensity. We propose a new approach upon conditional variational autoencoders and sensitivity analysis for assessing the influence of mixed variables on performance and test in on a gridshell design problem.
About the cVAE model
The optimal widths I for each MLP block were determined through empirical testing and found to be [64, 32, 16] for both the encoder and decoder. This indicates that the problem at hand is moderately complex and the accumulated parameters are significant.
Model performance on test set:
Model information:
a) predictive capabilities in embodied carbon 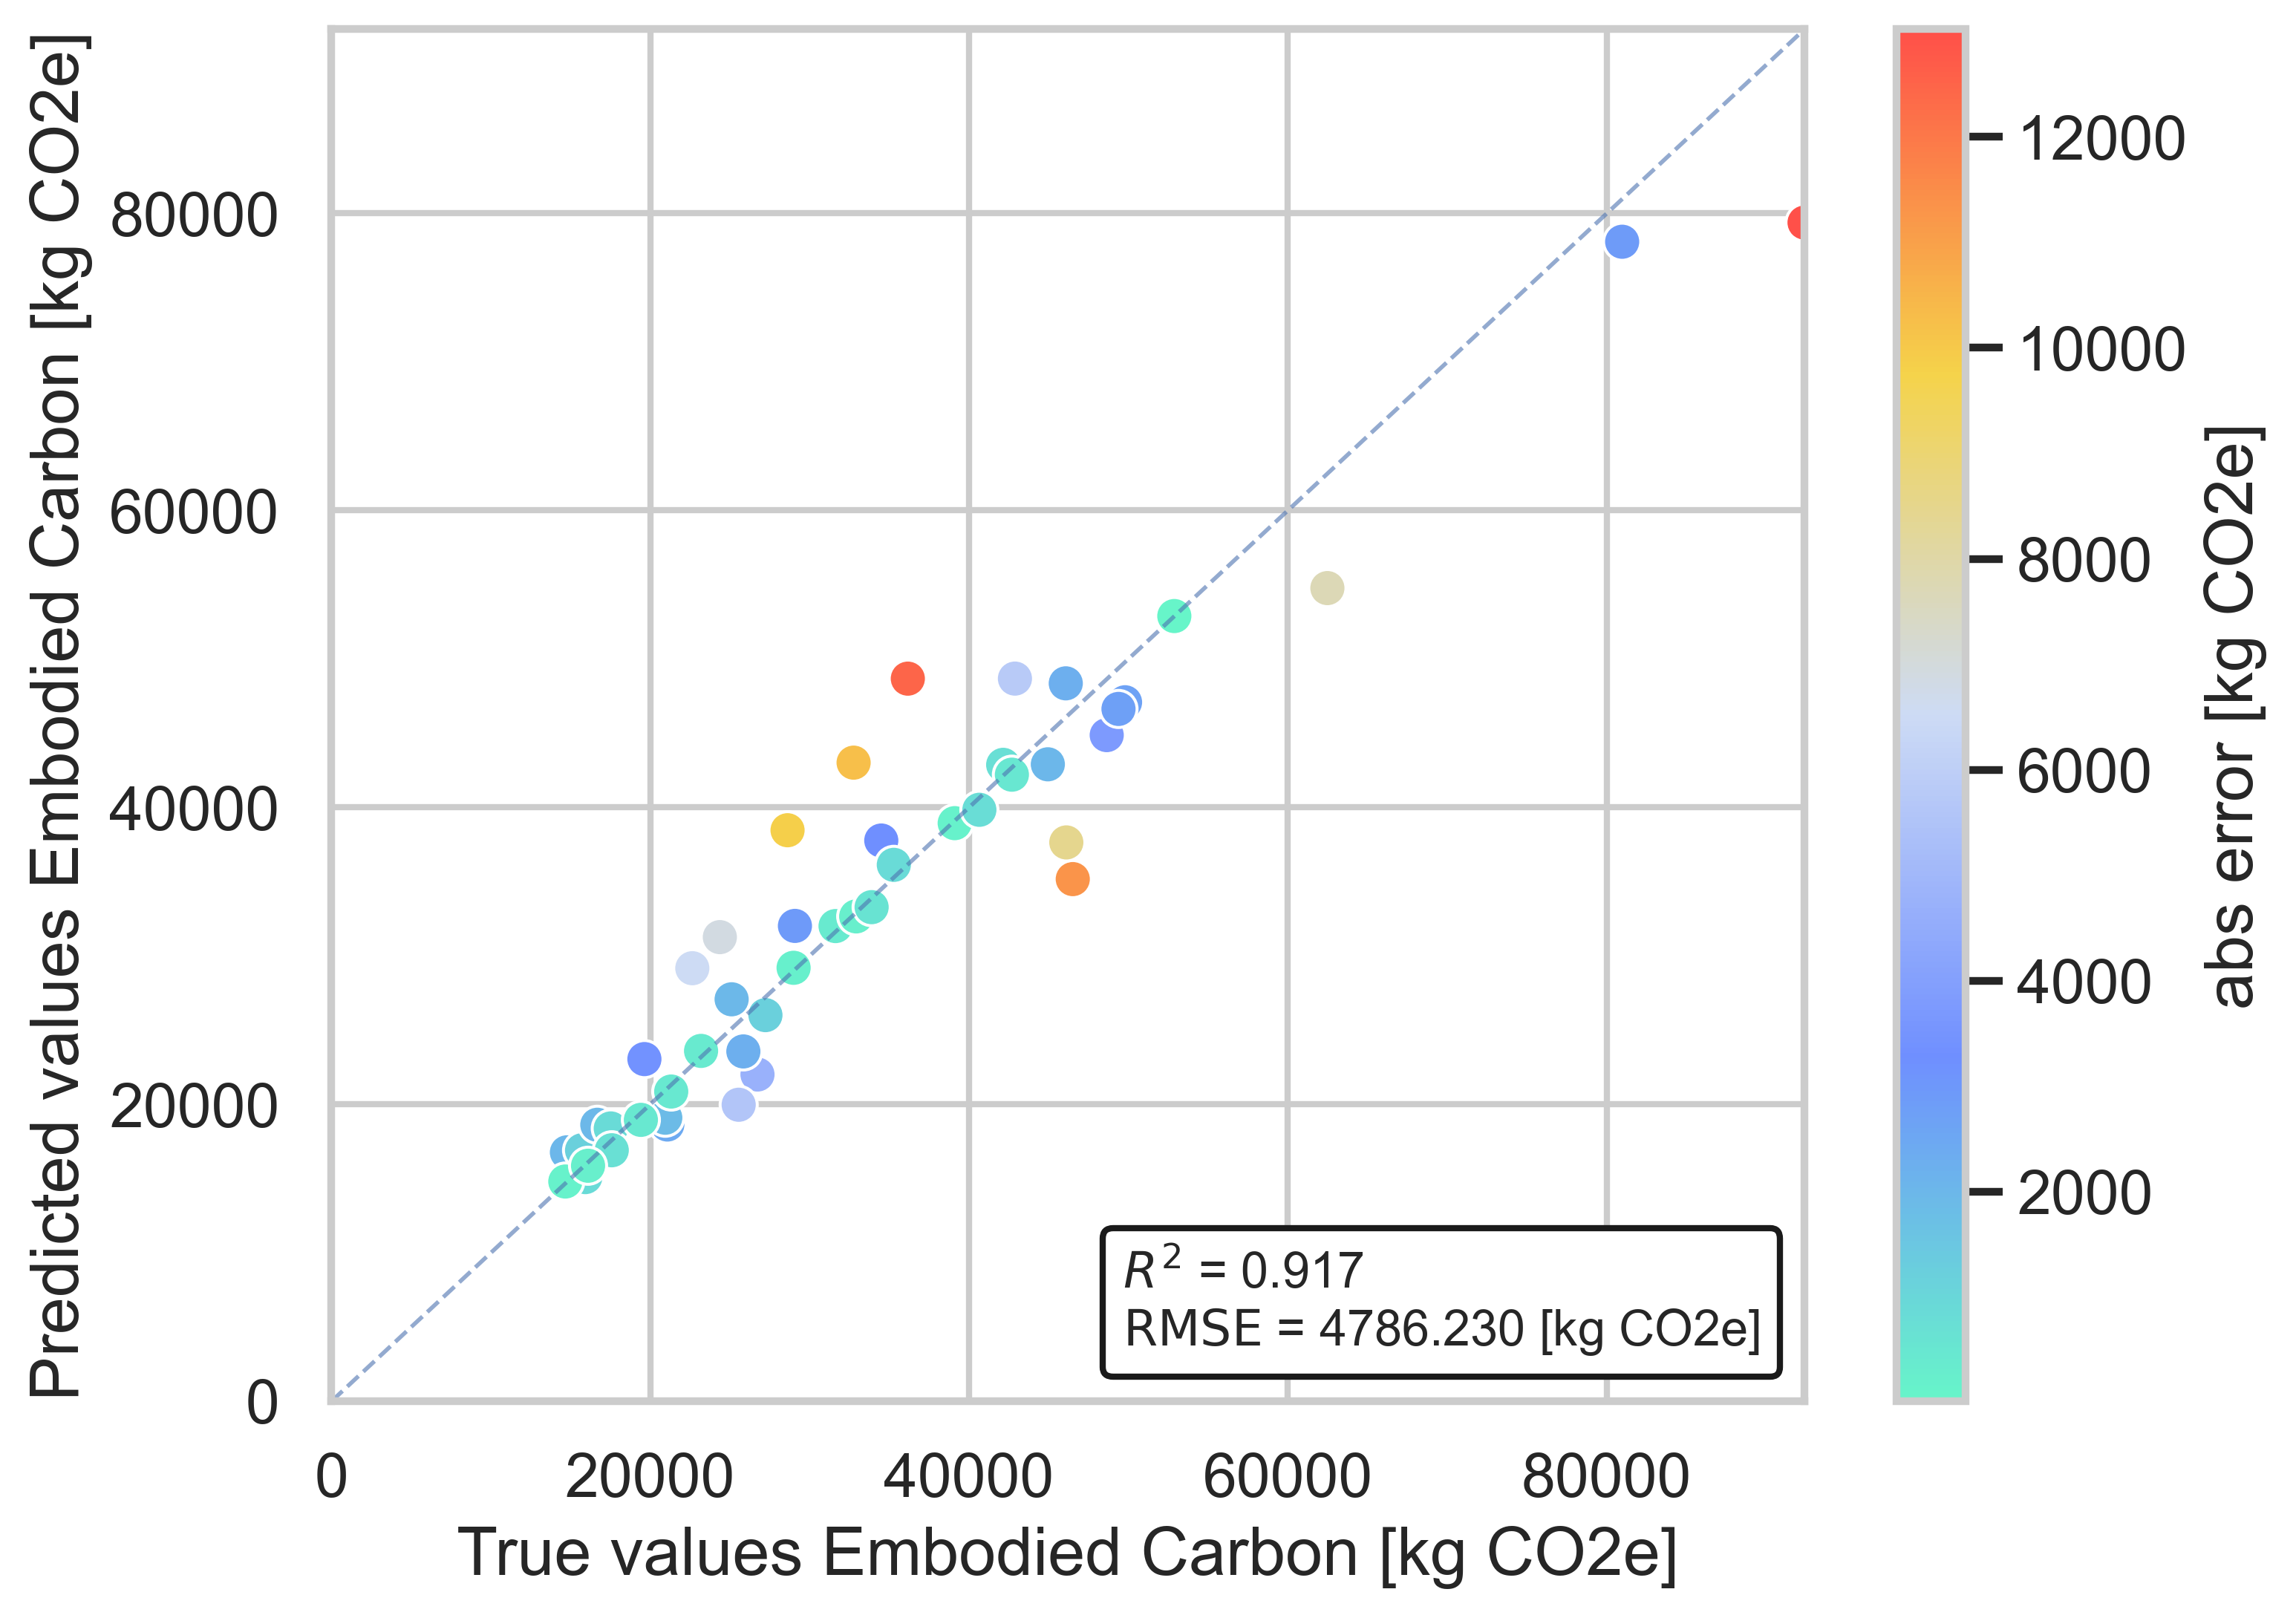 The predictions are accurate, as demonstrated by the bulk of data points falling on the diagonal. The prediction’s standard deviation varies based on the target quantity, and the prediction intervals are realistic.
b) confusion matrix for topology 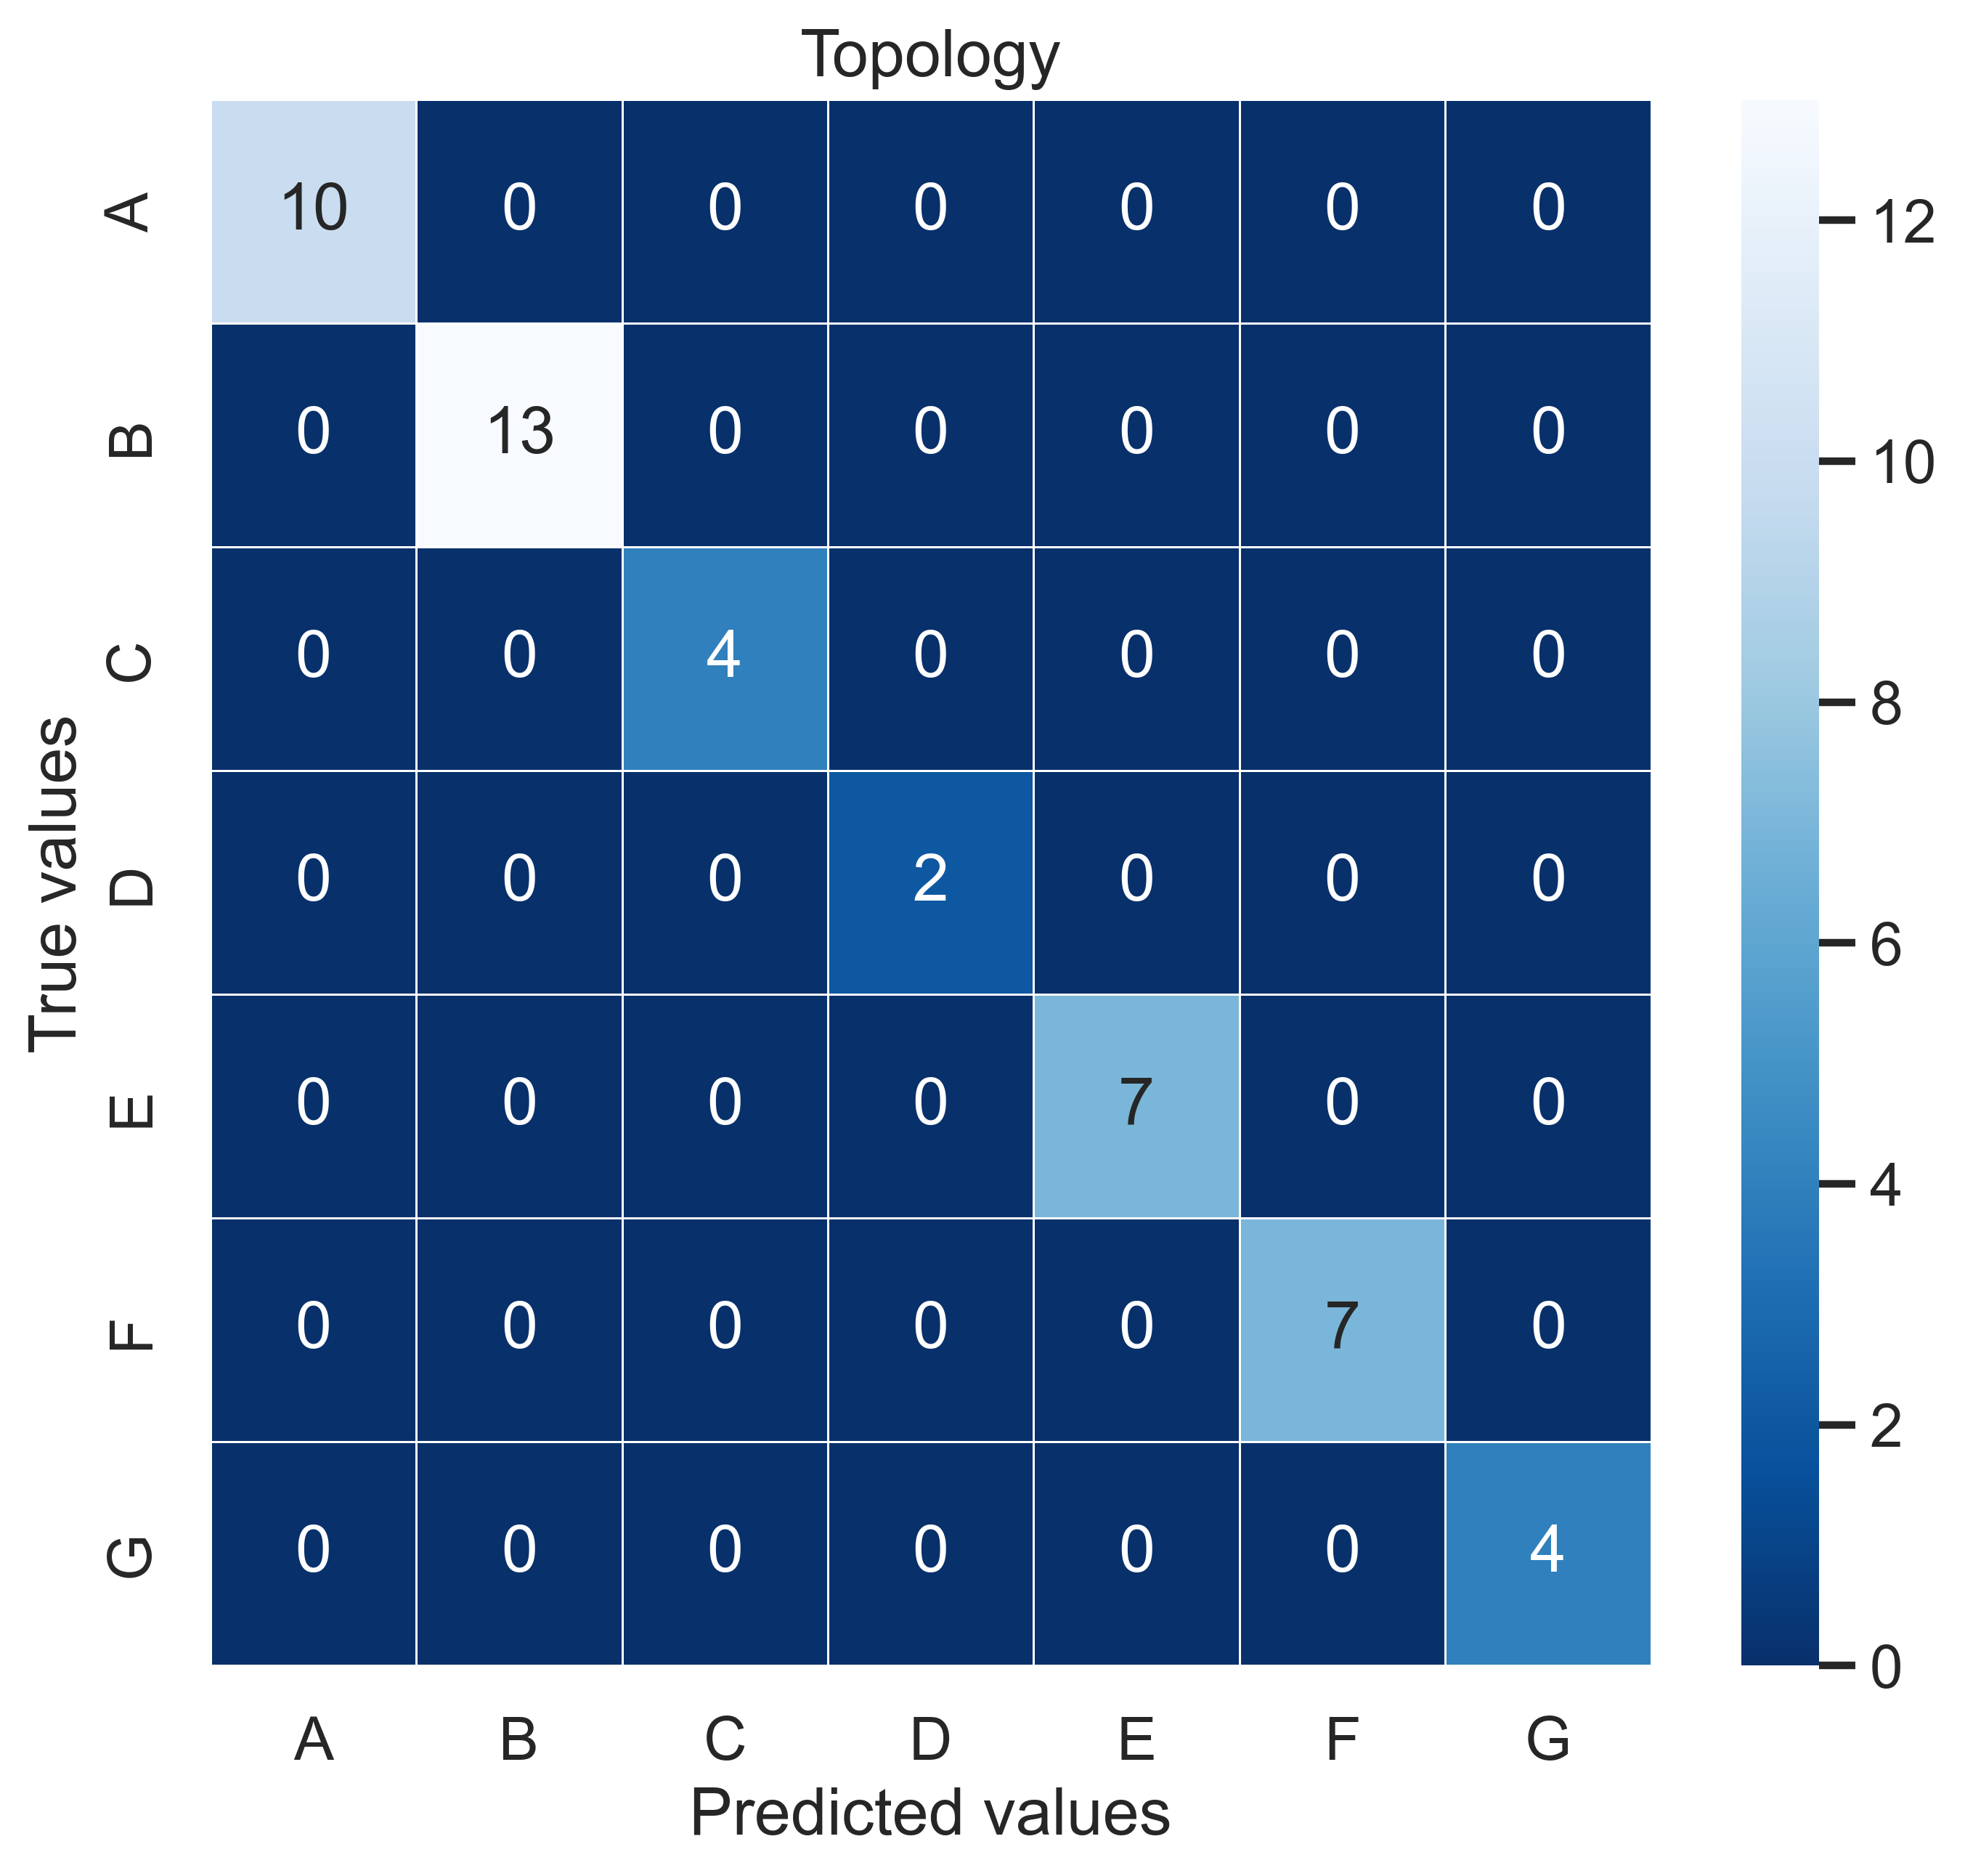 This confusion matrix shows a perfect reconstruction of all test points, as all predicted topologies match the original topologies.
To facilitate human interpretation, the latent space is assigned to be two-dimensional. The loss term weights are set to w_1 = 1, w_2 = 3, w_3 = 0.1, and w_4 = 0.01. The effect of w_3 can be observed by visually inspecting the latent space and coloring the points based on their y value. If the distribution is not normal, w_3 should be increased. Similarly, if there are correlations between z and y, w_4 should be increased.
Visualization of the latent space, with the points colored according to their respective cost:
a) density 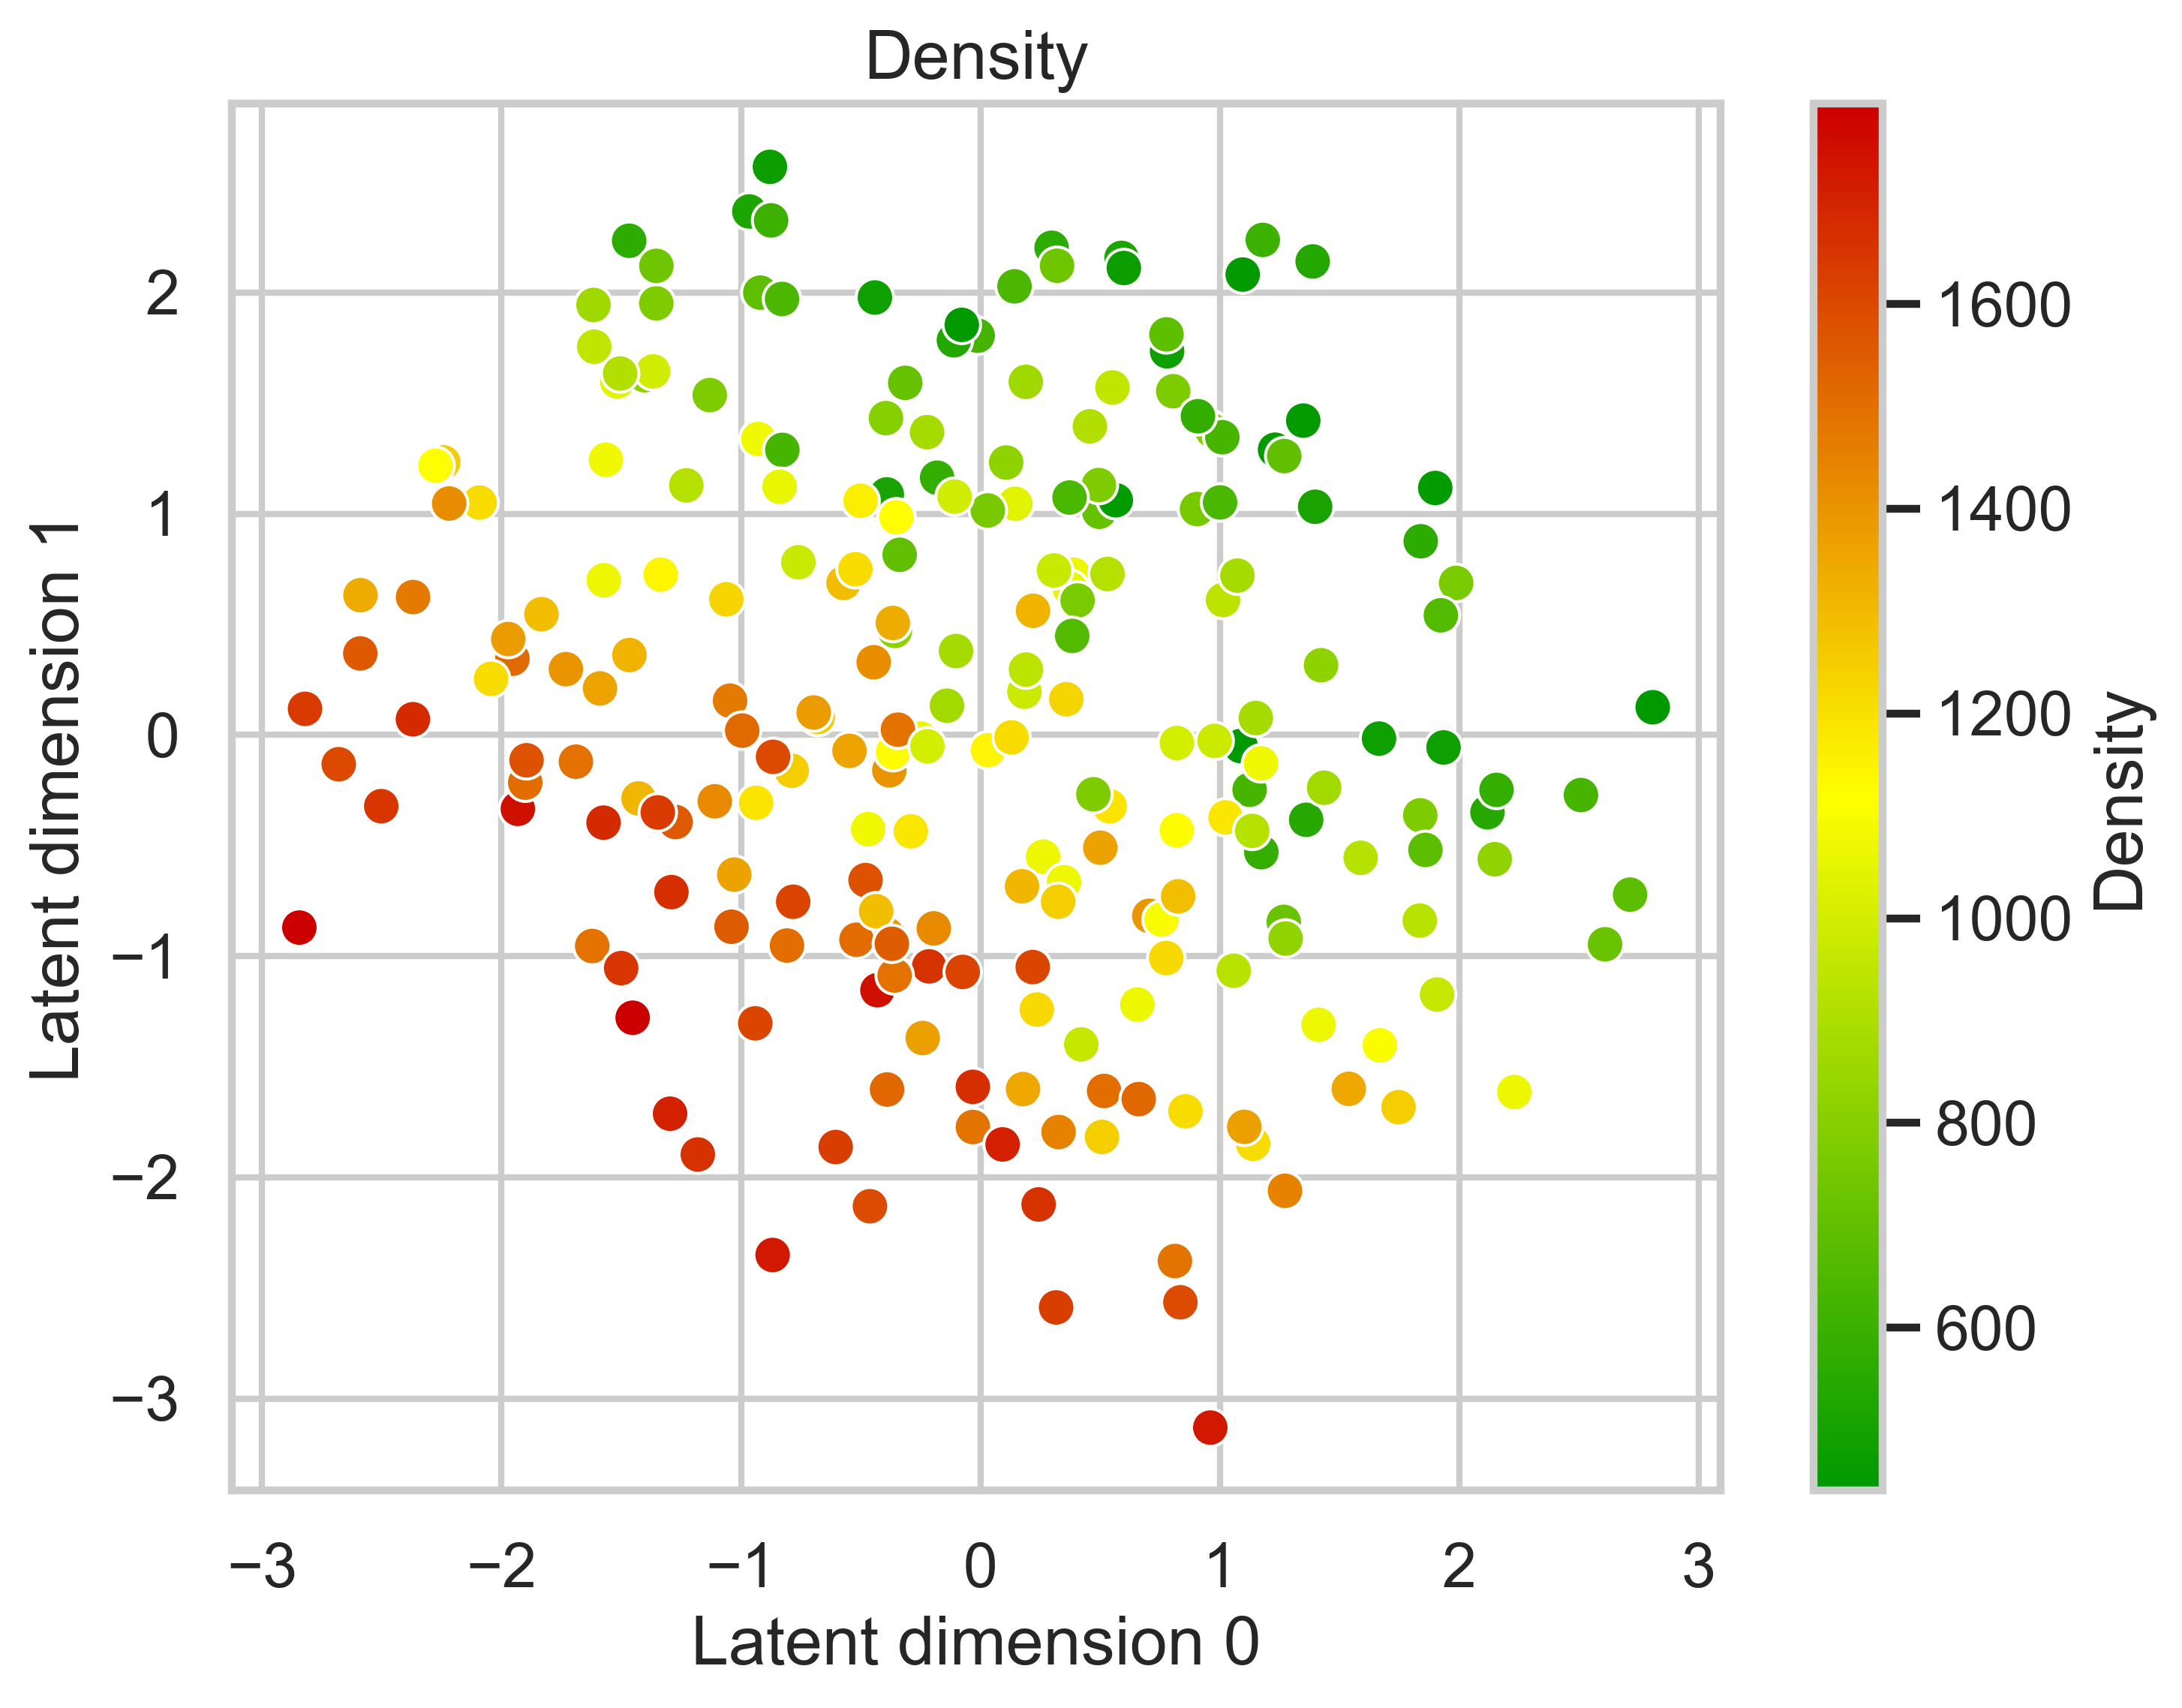
b) embodied carbon 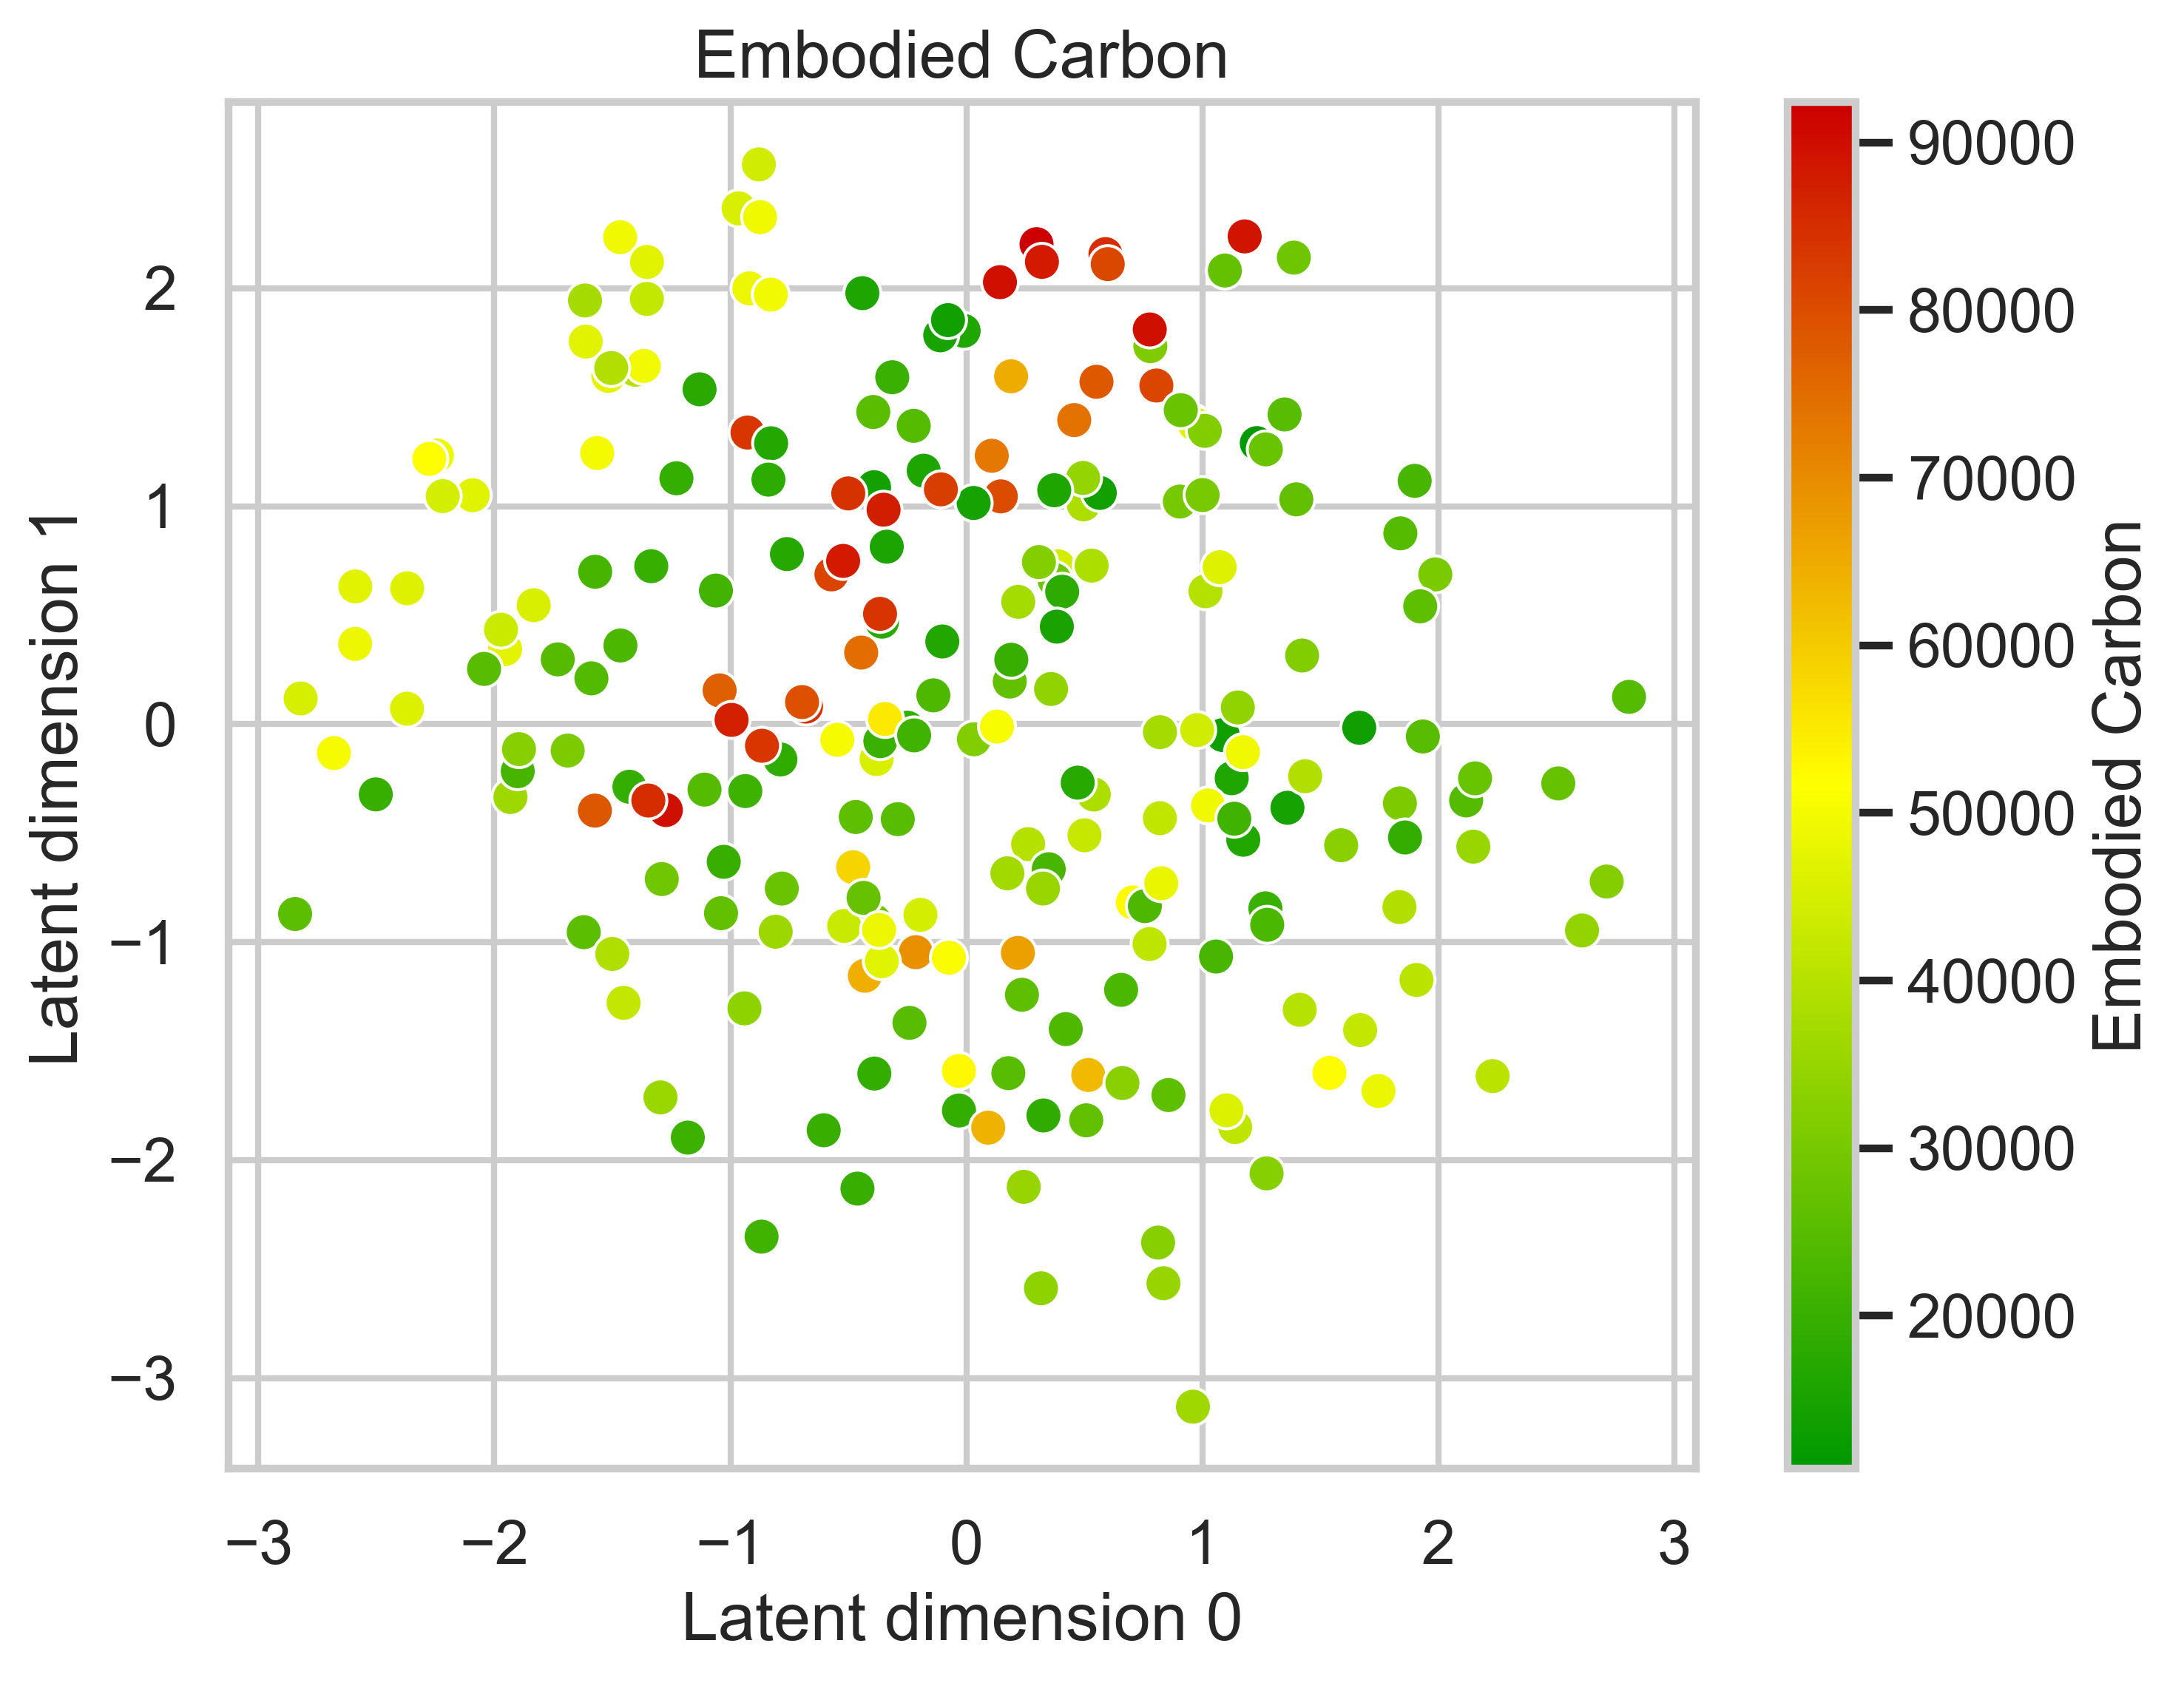
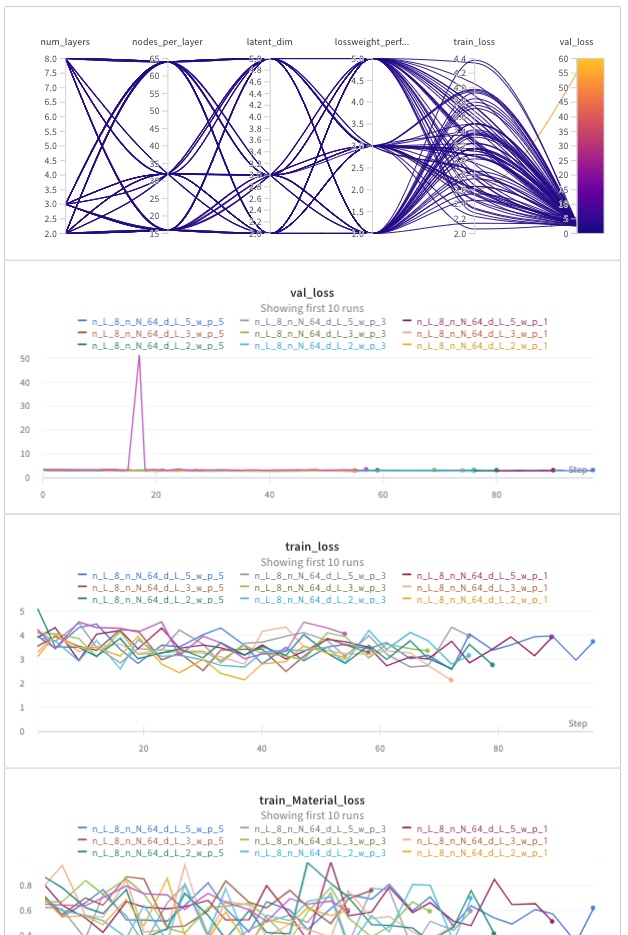
Visit this Weights & Biases project page for interactive details about the hyperparameters of the trained model.
Engineering assumptions for the case study
Steel material properties:
- Strength: 23.5 kN/cm2
- Modulus of elasticity E: 21,000 kN/cm2
- Specific weight: 78.5 kN/m3
- Embodied carbon coefficient: 1.23 kg CO2e/kg
Timber material properties:
- Strength: 1.3 kN/cm2
- Modulus of elasticity E: 1050 kN/cm2
- Specific weight: 6.0 kN/m3
- Embodied carbon coefficient: 0.51 kg CO2e/kg